Monitoring local Covid outbreaks with wastewater testing
Throughout 2021, my lab worked with Heather Bischel’s lab at UC Davis on realtime Covid outbreak monitoring with wastewater testing. Prof. Bischel’s team, led by her Ph.D. student, Hannah Safford, performed qPCR testing on wastewater in Davis. Basically, they would place samplers in maintenance holes and collect the sewage (fecal matter) to test for Covid-19 RNA concentrations. We used a control RNA, PMMoV, which is supposed to be a proxy for fecal matter concentration. We are then able to estimate Covid concentration in the population that is upstream of that maintenance hole. Much of our study was to do a correlation analysis of this statistic with the Saliva testing results in Davis.
There are several challenges to this study…
- The regions that are upstream of the sampling locations are not consistent with the census block groups in Davis (the spatial resolution of the Saliva testing results).
- Determining the upstream locations and their populations is non-trivial.
- Each qPCR test is performed on one of three wells, and each of them give can give a noisy result. Often this value is below the detection limit. If we impute this with 0 then we get a downward biased estimate of concentration.
Addressing all of these concerns was a tour de force in data science, requiring more planning than the usual academic team. The main milestones were
- Sampling and obtaining the initial RNA concentrations was performed by Prof. Bischel’s team, most importantly Hannah Safford. I will not elaborate on this heroic effort and the rapid turnaround of results to Healthy Davis Together.
- To map the upstream sampling locations to lat-long Lifeng Wei analyzed the Davis water network and identified all of the upstream maintenance holes for a given sampling location. Of course, the water network forms a directed acyclic graph.
- He created a cross-walk table between maintenance holes and census block groups (CBG) by weighting with census population numbers. So basically, each person in a CBG was given equal probability of having their waste enter into the maintenance holes in that CBG.
- At the same time, Xiaoliu Wu worked on imputing the qPCR data that is below the detection limit. This was performed via an EM-MCMC method. A Bayesian model was constructed for each sampling site and the prior parameters were estimated using maximum likelihood.
- All of this was motivated by extensive exploratory analysis, particularly visualizations to pin down the right Bayesian model.
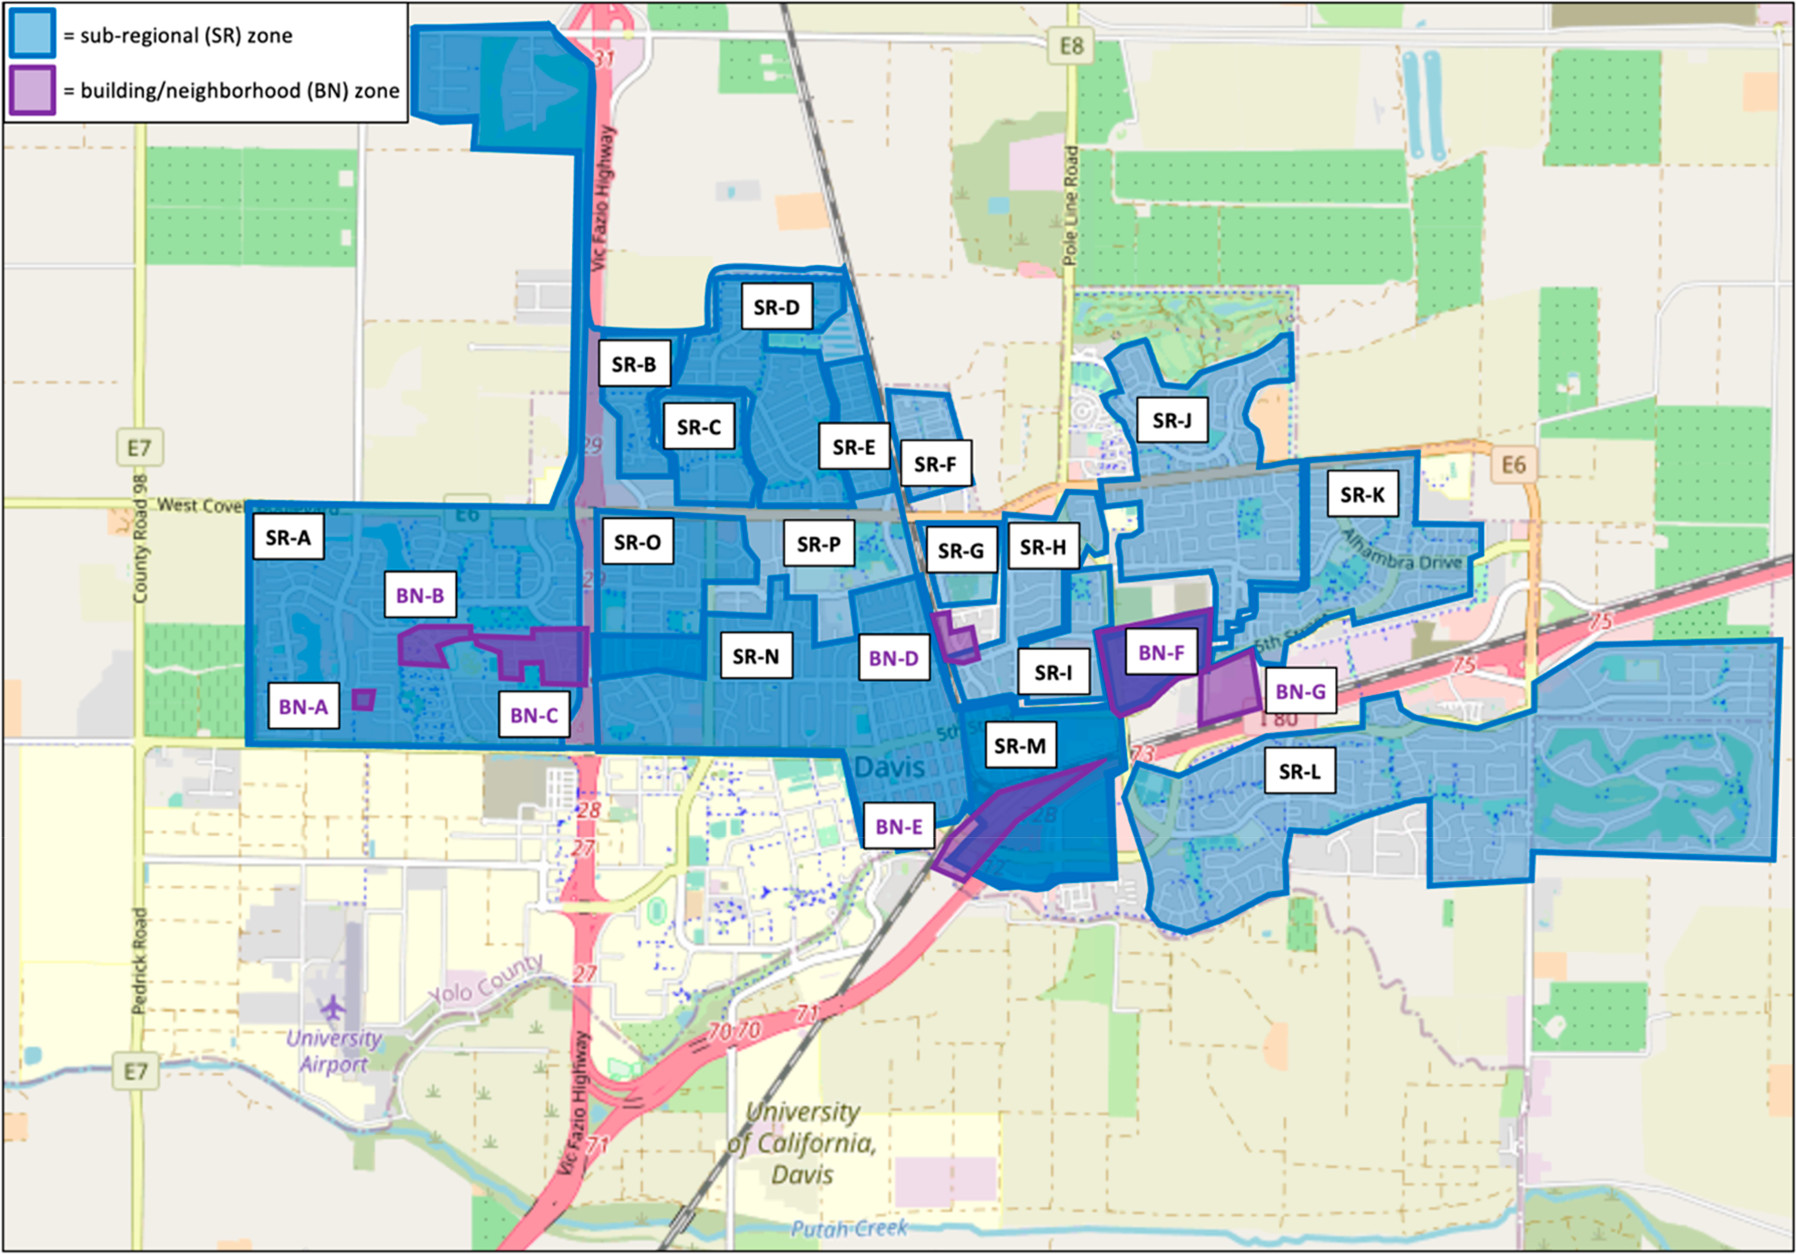
Regions of upstream locations for a sampling site.
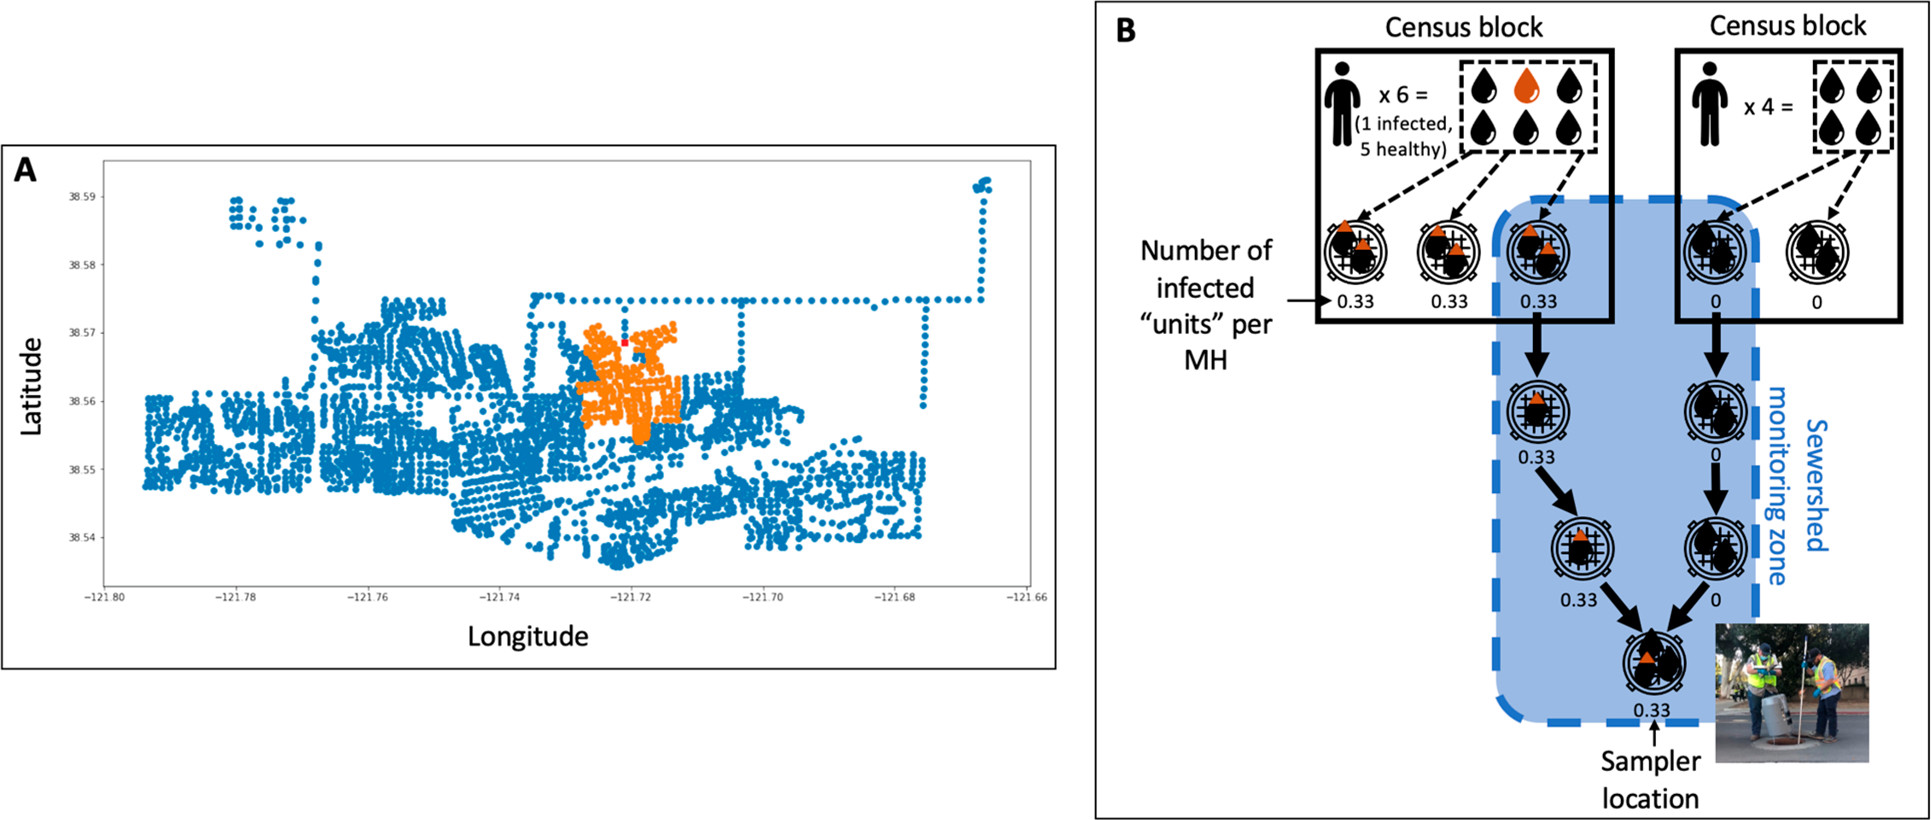
An illustration of how we form the cross-walk table between the waterwater regions and CBG.
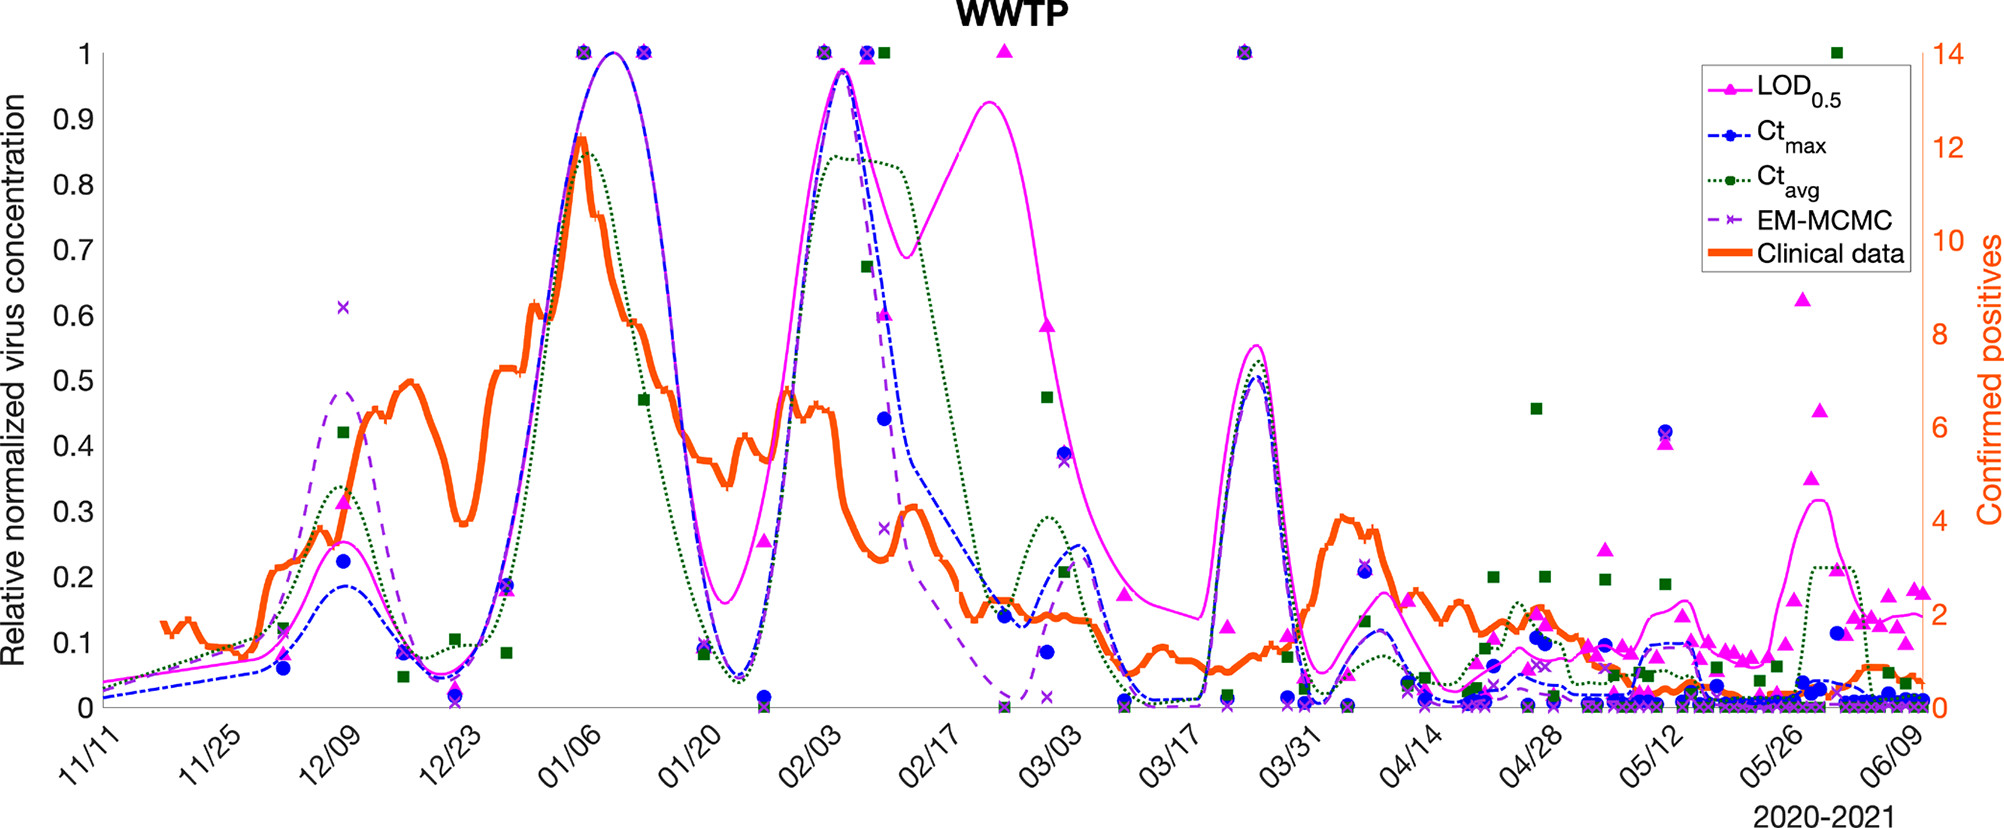
The imputed concentration time series for the wastewater treatment plan compared to simpler imputation methods.
The paper has been published in ACS EST Water,
Safford, Hannah, et al. “Wastewater-Based Epidemiology for COVID-19: Handling qPCR Nondetects and Comparing Spatially Granular Wastewater and Clinical Data Trends.” ACS Es&t Water (2022).